
In the hyper-competitive industrial landscape of 2026, maintaining a standard daily production report format for manufacturing industry is no longer just a clerical task—it is the pulse of your factory’s profitability. Whether you are running a high-tech electronics plant in Noida or a heavy engineering unit in Pune, the ability to track output, identify machine downtime, and monitor rejection rates in real-time determines whether you stay ahead of the curve or succumb to operational inefficiencies. Many Indian manufacturers often realize too late that missing data from a single shift can hide bottlenecks that drain thousands of rupees in wasted labor and material costs.
A consistent and professional production report format for manufacturing unit operations ensures that every stakeholder—from the floor supervisor to the plant head—is looking at the same version of the truth. Without a structured daily production report template manufacturing system, your facility operates in a data vacuum, leading to “estimated” results that rarely match the actual financial bottom line. This guide provides a practical, ready-to-use format designed specifically for Indian factories, helping you bridge the gap between daily floor activities and long-term cost control. At Construction Estimator India, we know that today’s production data is the foundation for tomorrow’s expansion planning and accurate project budgeting.
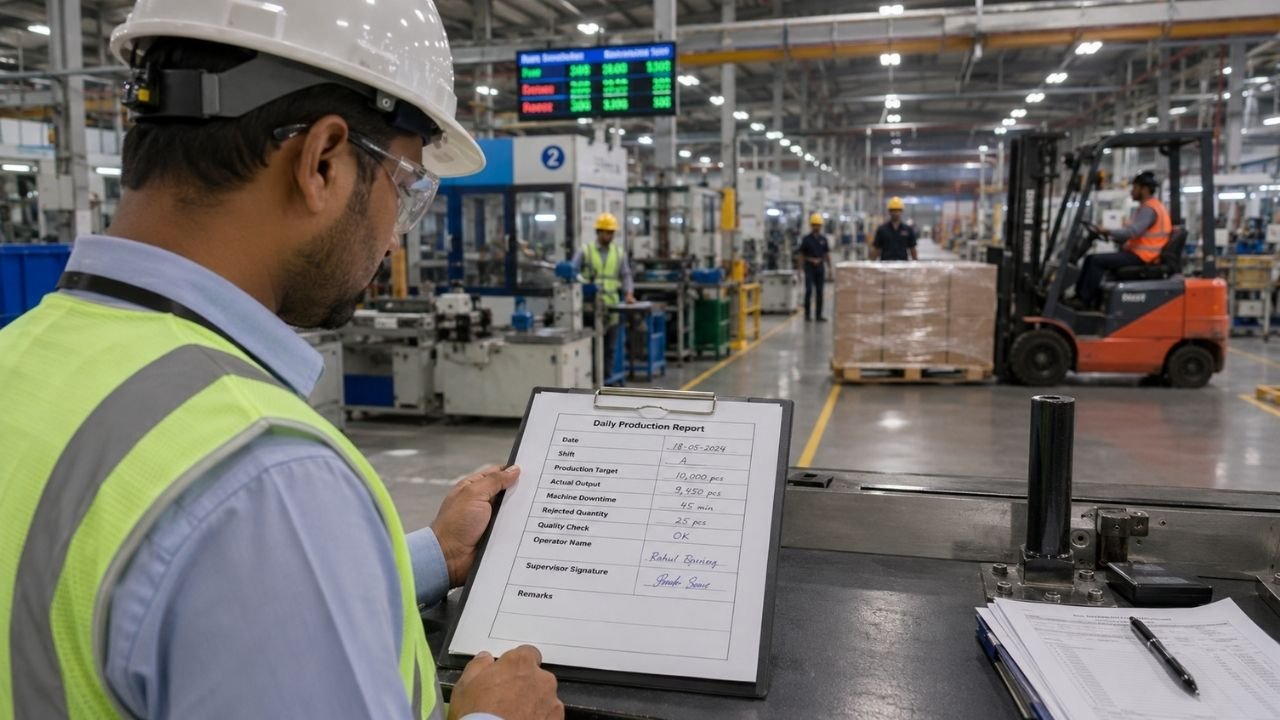
Why Daily Production Report is Critical for Manufacturing Industry
For any manufacturing unit owner in 2026, data is as essential as electricity. A robust daily production report format for manufacturing industry serves as a diagnostic tool for your business health.
- Real-Time Accountability: It assigns responsibility to specific shifts and operators, ensuring that targets are met or explanations are documented.
- Bottleneck Identification: By tracking machine-wise output, you can instantly see which equipment is underperforming or requires urgent maintenance before it causes a total line stoppage.
- Wastage and Quality Control: Monitoring rejection and rework rates daily helps in identifying faulty raw materials or calibration issues early, saving significant material costs.
- Informed Decision Making: Accurate data allows managers to decide whether to add an extra shift, invest in new machinery, or optimize the current factory floor plan layout for better flow.
- Cost Control and Budgeting: Daily reports provide the historical data needed to create accurate Bill of Quantities (BOQ) for future expansions or new facility setups.
Key Elements of an Effective Daily Production Report
A “good” report isn’t one that has the most columns, but one that has the right columns. A professional production report format for factory use must include these core elements:
- Basic Identification: Date, Shift (Day/Night), and Supervisor Name.
- Production Data: Product/Item name, SKU code, and the specific Production Line or Machine ID.
- Target vs. Actual: The planned production target versus what was actually achieved during the shift.
- Operational Efficiency: Total running hours versus downtime hours.
- Quality Metrics: Total quantity produced, total accepted, total rejected, and total rework.
- Resource Utilization: Manpower count (skilled/unskilled) and key material consumption.
- Downtime Analysis: Specific reasons for stoppages (Power failure, Machine breakdown, Material shortage).
Standard Daily Production Report Format for Manufacturing Industry
Below is a recommended structure that you can adapt into a manufacturing daily production report excel sheet or a physical register.
| Section | Field / Column | What to Record | Why It Matters |
|---|---|---|---|
| Header | Date & Shift | Current date and shift (A/B/C) | Tracking time-series performance. |
| Production | Machine / Line ID | Specific machine or line number | Identifies specific asset performance. |
| Output | Target vs. Actual | Planned units vs. Produced units | Measures productivity gap immediately. |
| Quality | Rejection / Rework | Number of defective units | Direct impact on material cost and ROI. |
| Time | Downtime & Reason | Minutes lost and why | Critical for OEE (Overall Equipment Effectiveness). |
| Labor | Manpower Count | Number of workers present | Tracks labor productivity and cost per unit. |
| Summary | Supervisor Remarks | Qualitative notes on the shift | Captures issues not shown by numbers. |
How to Fill the Daily Production Report Correctly
To ensure your daily production report sample data is reliable, follow these best practices on the factory floor:
- Fill as You Go: Don’t wait until the end of a 12-hour shift to fill the report. Record downtime and rejections as they occur to avoid “guesswork” at 7:00 PM.
- Be Specific with Downtime: Instead of writing “Machine Issue,” write “Motor Overheating” or “Sensor Calibration.” This helps maintenance teams act faster.
- Verify Raw Material Input: Ensure the material consumption recorded matches the physical stock issued from the store to prevent leakage or theft.
- Mandatory Sign-offs: The shift supervisor must sign the report, and the plant manager should counter-sign it the next morning. This creates a chain of accountability.
- Use Standard Units: Whether it is Kilograms, Meters, or Units, ensure everyone uses the same units of measurement to avoid calculation errors in your manufacturing daily production report excel analysis.
Sample Daily Production Report (Illustrative Example)
Here is how a completed daily production report sample might look for a plastic component manufacturing unit:
Date: Date | Shift: Day (8 AM – 8 PM) | Supervisor: Person
- Machine ID: Injection Molding M-04
- Product: 5-Liter Handle (Black)
- Target Production: 1,200 Units
- Actual Production: 1,050 Units
- Total Rejected: 45 Units (Short molding issue)
- Downtime: 90 Minutes
- Downtime Reason: Power fluctuation (30 mins) + Mold cleaning (60 mins)
- Manpower: 1 Operator + 2 Helpers
- Remarks: Output was lower due to early morning power issues. Mold M-04 requires servicing by Sunday.
Benefits of Using a Standard Production Report Format
Implementing a consistent production report format for manufacturing unit operations yields immediate advantages:
- Historical Data for Planning: When you plan a factory expansion, your historical daily reports tell you exactly how much capacity your current machines can handle.
- Simplified Audits: Whether for ISO certification or customer audits, having neat, organized daily reports demonstrates professional management.
- Faster Troubleshooting: When a customer complains about quality, you can trace the batch back to the specific shift and machine where it was produced.
- Reduced Friction: Clear data reduces arguments between production, maintenance, and quality departments regarding who is responsible for delays.
Common Mistakes to Avoid in Daily Production Reporting
Avoid these frequent pitfalls that render your daily production report format for manufacturing industry useless:
- “Pencil Whipping”: Supervisors filling in fake numbers just to meet targets on paper.
- Ignoring Minor Stoppages: Not recording 5-10 minute stoppages. Over a month, these “small” losses can equal days of lost production.
- Inconsistent Formatting: Using different templates for different departments, making it impossible to get a factory-wide view.
- Late Submission: Reports submitted 3 days late lose their value for immediate corrective action.
- Missing “Remarks”: Numbers don’t tell the whole story. Without remarks, you won’t know that a machine underperformed because of high ambient temperature or low-quality raw material.
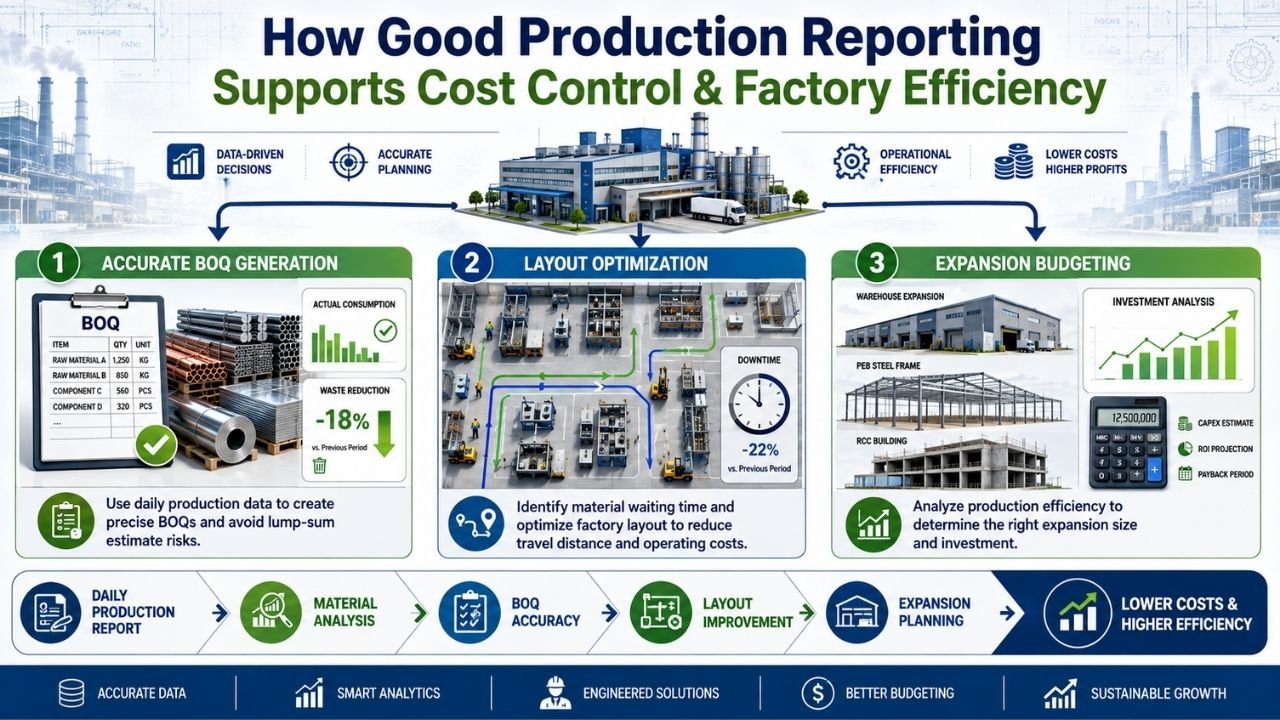
How Good Production Reporting Supports Cost Control & Factory Efficiency
Your daily production data is the “raw material” for financial engineering. At Construction Estimator India, we use this data to help factory owners optimize their costs:
- Accurate BOQ Generation: By knowing your actual material consumption and waste percentages from daily reports, we can create a much more accurate Bill of Quantities (BOQ) for your next project, preventing the common “lump sum” quote trap.
- Layout Optimization: If your reports show high downtime due to “Material Waiting,” it’s a sign your factory floor plan layout is inefficient. We can help redesign the flow to reduce travel distance and costs.
- Expansion Budgeting: When you decide to scale, we analyze your production efficiency to estimate the exact size of the new PEB structure or RCC unit you need, ensuring you don’t overbuild or underbuild.
How Construction Estimator India Helps Manufacturing Units
We bridge the gap between floor-level production and high-level industrial planning. While you manage the daily output, we help you manage the long-term asset value and construction costs.
- Practical Reporting Guidance: We help you refine your daily production report format for manufacturing industry to capture the data that actually matters for cost control.
- Realistic Cost Estimates: Planning a new shed or a mezzanine floor? We provide 2026 market-rate estimates for steel (JSW/TATA), VDF flooring, and labor.
- Technical BOQ Support: Our detailed quantity takeoffs help you secure bank loans by providing the technical documentation lenders require.
- Efficiency Reviews: We look at your production flow and suggest structural changes that can reduce your operational costs by 15-25%.
Get Daily Production Report Format Guidance + Project Cost Estimate Support
Don’t let inefficient reporting or “rough guess” construction quotes stall your growth. Whether you need a better way to track daily output or a bank-ready estimate for a new factory, we are here to help.
Our Simple 3-Step Process:
- Share Details: Tell us your manufacturing type, current production challenges, or plot size for expansion.
- Receive Guidance: Get a customized production report format for factory use and practical layout advice.
- Get a Quote: Receive a realistic construction cost estimate and BOQ within 24–48 hours.
Contact Construction Estimator India Today:
WhatsApp or Call: +91 8630676890
Expertise: 10+ years in Industrial Costing & Planning
Frequently Asked Questions (FAQs)
Q1. Should I use Excel or a physical register for daily production reports?
In 2026, a manufacturing daily production report excel or a cloud-based sheet is highly recommended. It allows for auto-calculations of totals, averages, and rejection percentages, which a register cannot do.
Q2. Who should be responsible for filling the report?
The Shift Supervisor or Line Leader is typically responsible for the data. However, machine operators should provide the raw numbers for their specific stations.
Q3. How does a production report help in reducing construction costs?
It identifies if your current space is truly utilized. Often, a “need for more space” is actually a “need for better layout.” Analyzing production data saves you from building unnecessary square footage.
Q4. What is the most important metric in a factory production report?
OEE (Overall Equipment Effectiveness) is key, but for daily control, “Target vs. Actual” and “Rejection Rate” are the most immediate indicators of health.
Q5. How often should management review these reports?
A brief “Morning Meeting” (10-15 mins) should be held daily to review the previous 24 hours of data and address any major issues.
Q6. Can this format be used for small workshops?
Yes. Even a 5,000 sq ft workshop benefits from a simplified production report format for manufacturing unit to track labor and material use.
Q7. Is Vastu compliance relevant to my production layout?
Many Indian owners (over 80%) prefer Vastu-compliant layouts for peace of mind and resale value. This can be integrated into your initial plan.
Q8. Why do banks ask for a BOQ based on my production capacity?
Banks need to see that your planned construction size matches your projected production and revenue. A professional BOQ provides this financial viability.
Q9. What is the average cost of factory construction in India in 2026?
Standard PEB factories range from ₹1,200 to ₹1,850 per sq ft, depending on height and location.
Q10. How can I get a custom template for my specific industry?
You can WhatsApp your requirements to +91 8630676890, and we will provide guidance on a format tailored to your production process.
Conclusion
A well-implemented daily production report format for manufacturing industry is the foundation of both operational excellence and financial control. In 2026, the manufacturers who win are those who treat their floor data with the same respect as their bank balance. By tracking every unit, every minute of downtime, and every kilogram of waste, you empower yourself to make decisions that lead to sustainable growth.
Ready to professionalize your factory reporting or plan your next expansion with data-backed precision? Don’t rely on guesswork that leads to budget shocks.
WhatsApp us now at +91 8630676890 for your custom production report guidance and an accurate factory cost estimate.